You are here
Content
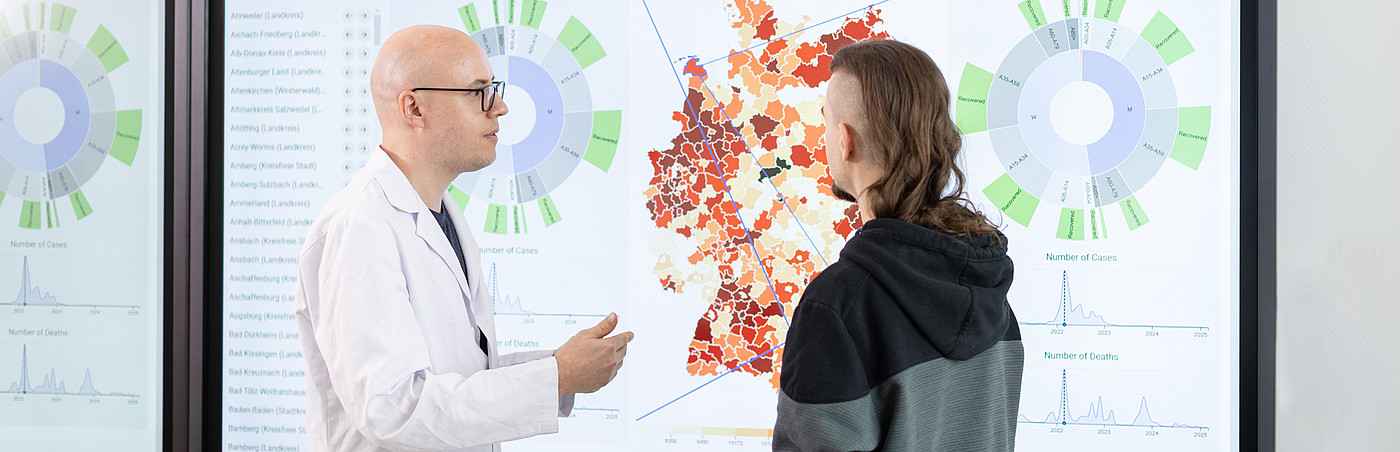
Our dashboards: insight into the world of clinical data
We aim to create meaningful visualizations in the form of dashboards for all clinical facilities and institutes at the Medical Faculty Mannheim. Regardless of your background or experience with clinical data, our visualization can help you gain important insights and make informed decisions.
What sets our dashboards apart
Our dashboards are characterized by their ease of use, flexibility, and customization options. It is essential for us to gain a comprehensive understanding of your individual needs and craft tailored solutions that align with your needs. Whether you are looking for a simple visualization of patient data or a complex analysis of clinical trial results, we have the right solution for you.
Our vision: Understanding data to improve lives
Our vision is at the heart of everything we do: understanding data to improve lives. By visualizing and analyzing clinical data, we help support informed healthcare decisions, improve the efficiency of treatments, and ultimately improve people's health and well-being.
Who are our dashboards for?
Our dashboards are aimed at all clinical facilities of the UMM as well as the institutes of the Mannheim Medical Faculty. Regardless of your background or experience with clinical data, our dashboards can help you gain important insights and make informed decisions.
Get in touch with us
If you want to learn more about our visualization techniques and how we build dashboards or are interested in working with us, please contact us.
Context Column

Biomedical Informatics
Medical Faculty Mannheim
Heidelberg University
Theodor Kutzer-Ufer 1-3
68167 Mannheim
Contact
Data Visualisierung
Programming language R

Data Visualisierung
Computer Graphics

René Warnking
rene.warnking@medma.uni-heidelberg.de