You are here

Content

Journal rankings

Journal ranking databases evaluate citations between articles of the evaluated journals and create different key figures (bibliometric indicators) per journal within a subject area. They can be used, for example, to check journals for their relative importance within a subject area, or - as an author - to select journals for future publications.

Selected databases with bibliometric data

In the databases a restriction to Open Access Journals is possible (except in Google Scholar Metrics).

SJR - Scimago Journal & Country Rank

The freely accessible database Scimagojr.com offers, among other things, the SCImago Journal Rank (SJR, from 1999), which is comparable to the Impact Factor (IF). But, among other criteria, the SJR  includes the prestige of a journal, i.e. citations of articles from frequently cited journals increase the prestige of the journal whose articles are cited.

The data basis is the database SCOPUS (not licensed in Mannheim), a competitor product to Web of Science, in which more journals are evaluated than in Journal Citaton Reports or Web of Science. A 3-year period is used for the evaluation of citations. Self-citations are excluded. The data are updated annually in November (new annual evaluation).

The journal display shows - sorted by subject area or for individual journals - in addition to the SJR e.g. quartile, H-index, scope note with source link, average citations per publication and degree of international cooperation.

With the Country Rank, individual countries and 8 world regions can be evaluated since 1996 according to subject areas - the values, among others, are number of publications, citations per publication (average), self-citations, non-cited publications and the H-Index (number of publications h that have received at least h citations).

One of the Viz Tools is the Subject Bubble Chart, which allows, among other things, to compare the medical specialties by means of bubble charts according to various criteria.

JCR - InCites Journal Citation Reports (Clarivate Analytics)

In the database Journal Citation Reports article and citation data from about 9500 mainly English-language journals in the fields of medicine, technology and natural sciences are evaluated annually (Science Citation Index Expanded (SCIE)).

Since 2022 the journals of the  Web of Science Core Collection editions Social Science Citation Index (SSCI), Arts & Humanities Citation Index (AHCI) and Emerging Sources Citation Index (ESCI) are included by default.

The data are published online in July of each year and refer to the evaluations of the previous year (JCR year).

Search, Browse journals/categrories, Compare

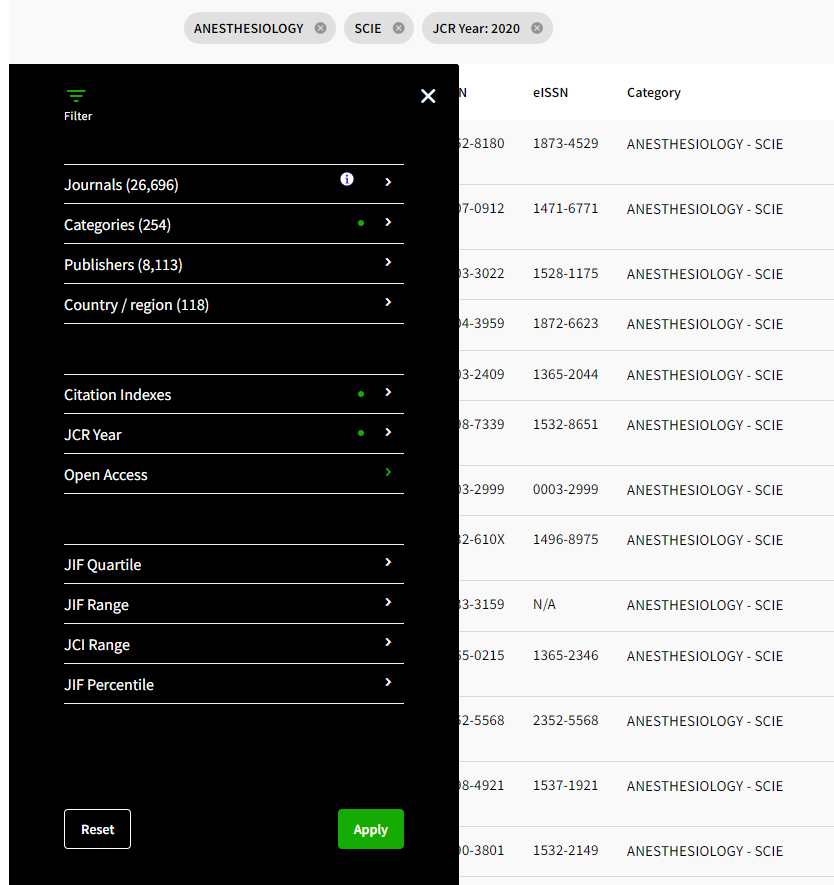
The search works with "journal name, ISSN, eISSN, category or keyword". "Browse journals" allows several filters, see screenshot below.

One choses a Group first via "Browse categories" , e.g. Clinical Medicine (see screenshot) and then a Category, e.g. Anesthesiology from the SCIE. Further filtering is possible, e.g. with Publishers or Open Access status and after the search/selection click "Apply", see screenshot.

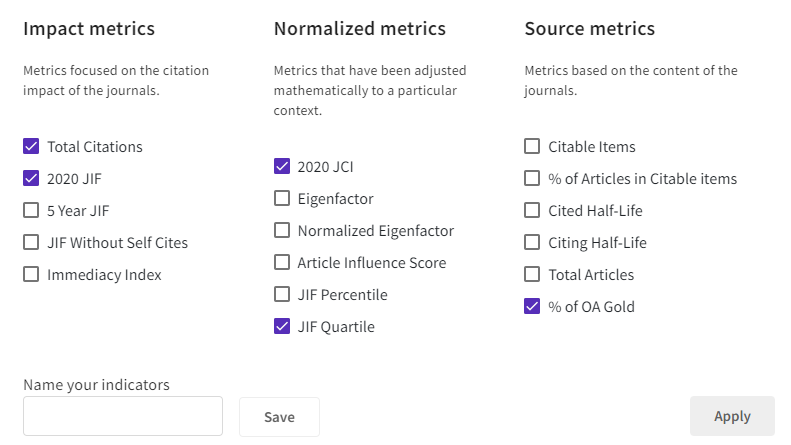
Up to 4 journals can be marked and compared line by line via Compare button (see screenshot).

Journal Impact Factor

For a given journal, the Journal Impact Factor (FIF) indicates how often the citable articles of the two years preceding the JCR year were cited on average in the JCR year. An impact factor of 1.0 thus means that each citable article of the past two years was cited once on average. The citations can be from the same journal. (Journals from the Arts & Humanities (AHCI) and Emerging Sources Citation Index (ESCI) have no JIF.)

Note of the database producer: "The Journal Impact Factor (JIF) is a journal-level metric calculated from data indexed in the Web of Science Core Collection. It should be used with careful attention to the many factors that influence citation rates, such as the volume of publication and citations characteristics of the subject area and type of journal. The Journal Impact Factor can complement expert opinion and informed peer review. In the case of academic evaluation for tenure, it is inappropriate to use a journal-level metric as a proxy measure for individual researchers, institutions, or articles."

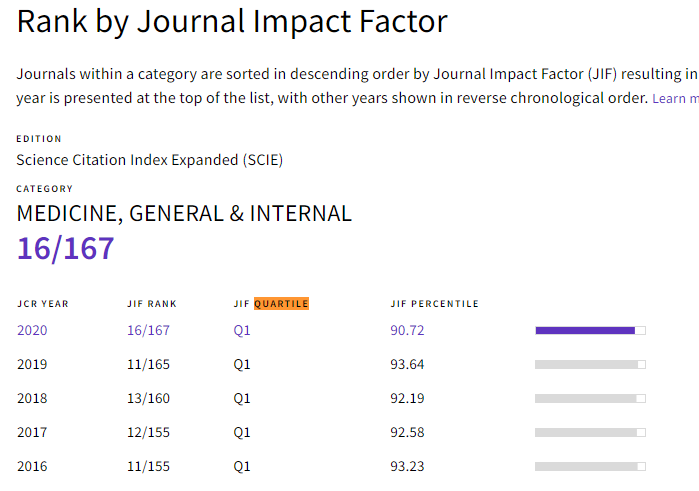
Example below of a  journal in the JCR year 2020:

Note: "Citeable items" in the denominator are usually research articles and reviews. In the numerator, on the other hand, the citations of all document types of all Web of Science-journals are counted also on the non-quotable document types such as editorials, letters, news items and meeting abstracts.

Journal Citation Indicator (JCI) - NEW since 2021

"The Journal Citation Indicator (JCI) is the average Category Normalized Citation Impact (CNCI) of citable items (articles & reviews) published by a journal over a recent three year period. The average JCI in a category is 1. Journals with a JCI of 1.5 have 50% more citation impact than the average in that category. It may be used alongside other metrics to help you evaluate journals."

"The Journal Citation Indicator (JCI) is based on the mean category normalized citation impact (CNCI) for the journal. CNCIs are calculated at the document level and are based on citations from all documents in the three previous years and the JCR Year to articles and reviews published in the previous three years. The JCI is normalized for document type, publication year, and category. The average JCI for any category is 1. A JCI of 2 indicates that a journal is receiving twice the expected number of citations for the average journal in the category. A JCI of 0.5 indicates a journal is receiving half the expected number of citations for the average journal in the category. As citations distributions are skewed towards larger numbers of papers with fewer citations, the majority of journals in a category may have a JCI < 1."

Further values of the JCR (selection)

In the JCR, further indicators are determined both for individual journals and for individual subject categories, see the following overview for individual journals by type of calculation.

Journal Rank in Categories

Specifies a ranking value for the respective journal in the subject area, based on the Journal Impact Factor (JIF) or the Journal Citation Indicator (JCI), plus Quartile and Percentile data, see screenshot.

Immediacy Index

The "Journal Immediacy Index" shows the average number of citations for a journal in its year of publication. It is calculated by dividing the number of citations in a year by the number of articles in that year. The citing articles can also come from the same journal.

The "Aggregate Immediacy Index" is the value for a subject area.

Cited Half-Life

The Journal Cited Half-Life is the mean age of the articles cited in the JCR year, i.e. half of the citations to a particular journal refer to articles published within the determined year value (calculated backwards from the JCR year).

An example: Journal X has a value of 7.0 years in the JCR year 2006. This means that 50% of all citations from 2006 that refer to journal X occurred between 2000 and 2006 (inclusive).

The "Aggregate Cited Half-Life" is the value for a subject area.

The higher the value, the longer the average half-life of an attachment. Less modern or less fast-moving subject areas, where the citation maximum is reached only after more than 2 years, can possibly compensate for a lower impact factor with a higher half-life by multiplying the two values, see https://en.wikipedia.org/wiki/Impact_factor (accessed on  08.05.2020).

Citing Half-Life

The journal Citing Half-Life is the mean age of the articles cited by a journal in the JCR year, i.e. half of the citations in a journal refer to articles published within the determined year value (calculated backwards from the JCR year).
An example: The journal X has a value of 7.0 years in the JCR year 2006. This means that 50% of all articles cited by articles in journal X in 2006 were published between 2000 and 2006 (inclusively).

The "Aggregate Citing Half-Life" is the value for a subject area.

Eigenfactor and Article Influence Score

The calculations take into account, among other things, the prestige of a journal. A 5-year period is used for the evaluation of citations. Self-citations are excluded.

The Article Influence Score is a value for the average influence of the articles in a journal and is therefore comparable to the Journal Impact Factor. The average article in JCR journals has an AI score of 1, so an AI score of 5 should mean that the article in that journal has an average influence of five times the average influence.

The Eigenfactor score is a value for the importance of a journal for the scientific community. The value should be a measure of the amount of time users spend reading a journal. The self-factor score doubles if a journal publishes twice as many publications per year with the same "quality".
Since the values are very small, the Normalized Eigenfactor was introduced in order to make the values easier to read and compare. The average Normalized Eigenfactor score of JCR journals is 1, so the value 5 should mean that the journal has five times the influence.

Comments on the Journal Impact Factor

  • Comments on the JIF

    In order to correctly assess the value of impact factors, it is essential to consider a number of conditions and weaknesses:

    • The impact factor does not necessarily say anything about the quality or perception of an individual article, since relatively few articles in a journal receive the majority of citations!
    • Impact factors within the field of medicine vary from discipline to discipline and are not directly comparable, for example, because large or rapidly growing disciplines have more researchers and publication organs.
    • The selection of the JCR journals is solely up to the producer of the database. Mainly English language journals are evaluated. Many German language journals with peer-reviewing are not included in the JCR.
    • Non-English language journals have a relatively lower IF because of the low coverage in the JCR and because of the language barrier they receive less attention worldwide.
    • The IF can be manipulated by intentionally citing the same journal (self-citation).
    • Journals whose articles are regularly cited substantially longer than two years (longer half-life) are rated comparatively worse, see Cited Half-Life (further IF values).
    • New branches of research are cited less frequently.
    • Basic research is rated higher than clinical medicine, since it is strongly related to basic research.
    • Many citations to non-citable document types increase the IF.
    • Journals with a high proportion of reviews can have a comparatively higher IF, since reviews are cited more frequently on average than research papers.
    • Journals with free access to the full texts (open access) have a comparatively high IF.
      (Open Access in the life sciences.)

    Most of the points mentioned here are taken from the essay Dong; Loh; Mondry: The "impact factor" revisited (published on 05.12.2005).

  • AWMF propsal for the use of the IF

    The AWMF Commission "Quality Development in Research and Teaching" sets out the AWMF's position on the "Use of the Impact Factor" from 2000/2001 on the AWMF Research and Teaching page (in German). In the section "Mean impact factors (mIF) of the fields in the Science Citation Index (SCI) for subject-specific weighting" (in German), the article Bibliometrics in medicine - the AWMF's position (in German) from 2012 is linked. The main recommendations are:

    • Method for area-specific weighting
    • Doubling of the impact factor for German-language journals
    • Evaluation of publications in professional journals not listed in the SCI and SSCI
    • Evaluation of contributions in textbooks, manuals and monographs

Google Scholar Metrics

This freely accessible online service links a top 20 ranking of English-language journals per subject area or sub-sub-subject to the cited articles that are responsible for the ranking position.

The directory is created annually in July and refers to articles that have been indexed in Google Scholar for the last 5 completed years. There are some documented references to this.

For biomedicine, there are 72 subcategories in the Health and Medical Sciences category, and around 10 eligible subcategories in the Life Sciences (& Earth Sciences) category.

Sorting is according to h5-index*. By clicking on the h5-index value, the h articles of the respective journal are displayed, sorted by the number of citations (Cited by). Now you can either jump directly to the publisher's page of the desired article, or you can click on the respective cited by link and get linked article references again.

*(using 2013 as an example: h5-index is the h-index for articles published in the last 5 complete years.
It is the largest number h such that h articles published in 2008-2012 have at least h citations each
.)

A comparable JCR ranking would be the 5-Year Impact Factor.

Note when using articles: Only if you access metrics or key figures via the link on our homepage or Google Scholar page, you have access to licensed full texts from outside the faculty network as authorized user.

CiteScore

CiteScore is a metric developed by the Elsevier company on the basis of the database Scopus (About Scopus). In contrast to the Scopus database (which is not licensed by the University of Heidelberg), CiteScore is accessible free of charge.

"CiteScore 2021 counts the citations received in 2018-2021 to articles, reviews, conference papers, book chapters and data papers published in 2018-2021, and divides this by the number of publications published in 2018-2021."

The journal display - sorted by subject area or for individual journals - shows other values besides the CiteScore, such as SNIP (Source-Normalized Impact per Paper, a value that takes into account the differences in citation customs between the different subject areas) and SJR (Scimago Journal and Country Rank, which uses an algorithm similar to the Google PageRank method to include the prestige of a journal in the calculation).

In addition to the CiteScore itself, the metric contains seven other indicators, including the CiteScore Tracker, which is calculated like the CiteScore, but for the current year, in monthly updated form.


Related Pages

    Context Column