Sie befinden sich hier
Inhalt
H. Meyer, K. Baudendistel, M. Bock, R. Metzner, L. R. Schad
Introduction
Over the past years functional Magnetic Resonance Imaging (fMRI) has become a useful tool for mapping cortical activity and identifying functional areas. Besides the visual cortex, the sensorimotor cortex has been investigated extensively. Reliable paradigms for locating the sensorimotor cortex are known. Recently, attempts have been made to study the somatosensory cortex [1].
To further investigate the connection between brain activity and blood oxygenation level dependent (BOLD) signal changes, it is important to have reproducible paradigms. In this work, we present a new vibrotactile stimulation task, and compare it to two established paradigms.
Materials and methods
The fMRI experiments were performed on a 1.5 Tesla whole body scanner (Magnetom VISION, Siemens, Germany) using a conventional circular polarized head coil. A T2*-weighted multislice echo planar imaging (EPI) sequence (TR/TE/a /MAT/TH=4s, 54ms, 90°, 128 x 128, 4mm) [2] was used to acquire 14 consecutive axial slices covering the somatosensory and the sensorimotor area.
Three different experiments were performed on 11 volunteers (age 23-31 years):
- a) Finger tapping task: A self-paced right index finger to right thumb opposition movement task. The task rate cannot be determined quantitatively.
- b) Pronation/supination task: A mechanical device was used for monitoring the pronation/supination (PS) (i.e., rotational) movements of the right hand. The PS device offers a method to verify the mean task performace rate retrospectively [3].
- c) Vibrotactile stimulation: Two pneumatically vibrating clips stimulated right thumb and right index finger. The clips are driven by valves (Festo, Germany) at an input pressure of 2 bar. Frequency and pattern are computer controlled and can be chosen arbitrarily. In this experiment, frequency was set to 3 Hz (pulse width: 35ms), and both fingers were stimulated simultaneously.
For each experiment, 80 images per slice were measured, alternatingly acquiring 10 images at rest and 10 images during stimulation. Motion correction and calculation of a t-test parameter map (p<0.005) was performed using the AFNI96 software package [3].
Results and discussion
The t-test map of the finger tapping task as well as the PS task reveal the well known activation of the contralateral sensorimotor cortex and the supplementary motor area (SMA) in 9 subjects. A typical example is shown in Fig. 1a, 1b. Two subjects dropped out because of motion artifacts.
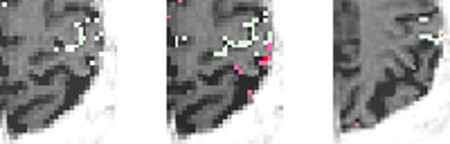
The vibrotactile stimulation shows activation in the contralateral hand area of the somatosensory cortex (Fig. 1c). It was detected in 6 subjects, and is less intense compared to the sensorimotor activation of methods a) and b).
The quantity and size of the activated area depends on the stimulation rate.
Comparisions between different subjects are problematic if the stimulation rate is not exactly known, as is the case with method a). With method b) a rate supplied by a metronome can be monitored and verifyed afterwards. However, with vibrotactile stimulation, the rate can be set to a fixed value. Thus, interindividual variations due to different activation rates can be eliminated.
In conclusion, vibrotactile stimulation can serve as a more reliable paradigm, even though activation is less intense. Furthermore, this paradigm yields a method for comparing fMRI and MEG results.
References
[1] Hummel, S., et al., Proc. ISMRM VI,3, 1550 (1998)
[2] Baudendistel, K., et al., MRI, in press, (1998)
[3] Baudendistel, K., et al. MRI14, 51-58, (1996)
[4] Cox, R.W., Computers and Biomedical Research, 29: 162-172, (1996)