Sie befinden sich hier
Inhalt
Theoretical prediction of parameter stability in quantitative BOLD MRI: dependence on SNR and sequence parameters
M. C. Sohlin1, and L. R. Schad2
Introduction
A static dephasing model [1] that analytically connects BOLD signal to hemodynamic parameters can be used to map the blood oxygenation level (Y) and venous cerebral blood volume (vCBV) in the brain. An extended version of this model was recently demonstrated with promising results in vivo [2], and has just been validated in a rat model [3] where the cerebral venous oxygenation was manipulated by anesthesia methods. However, the separation of Y and vCBV requires a very high SNR resulting in long measurement times. Furthermore, it has been anticipated that even at high SNR it may not be possible to separate those parameters accurately [4]. In this work, the accuracy of the method is tested by means of simulations and measurements. The SNR dependence is investigated as well as the dependence on the sequence parameters used during the experiment.
Materials and methods
To investigate the possibility to separate Y and vCBV, without influence of other parameters, a simplified model was adopted (T2 decay, blood signal, diffusion etc. were neglected). The MR signal-time development was calculated according to eq. A15 in [1]. The susceptibility difference between veins and brain tissue was set to 0.58 ppm (estimation of Y is equivalent to measure the susceptibility difference, Δχ, between deoxygenated blood and brain tissue), which corresponds to an oxygenation level of about 50 % and vCBV was set to 0.03. Fifteen sequence parameter setups were implemented where the total numbers of echoes, the number of the gradient echo that coincides with the spin echo and the difference between two adjacent echoes were varied. Gaussian noise was added to the signal, which was subsequently evaluated using least square curve fitting. The procedure was repeated 500 times for every parameter set. The procedure was repeated using vCBV as a fix parameter and with a T2 value of 80ms. Evaluation was performed with one (Δχ), two (Δχ and vCBV) and three (Δχ, vCBV and R2) fit parameters. In vivo measurements were achieved at a 3T system (SIEMENS TRIO) using a 32-echo GESSE sequence where the spin echo occurred at the 13th gradient echo (87ms) and with an echo distance of 3 ms. A relative CBV map was computed using EPI based contrast agent dynamic. In white matter, an area with homogeneous CBV (5x5 pixels) was selected for evaluation. Each pixel was evaluated using 3 fit parameters and subsequently with the vCBV fixed at 1.5 %.
Results
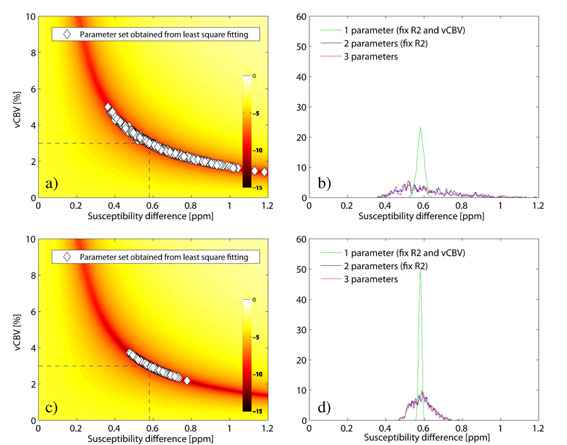
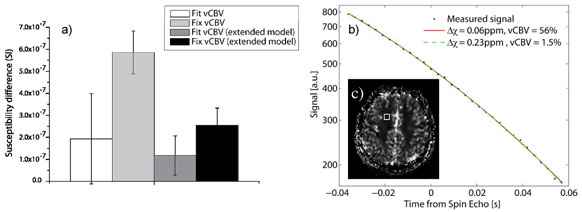
Figure 1 shows the parameter distribution and Δχ-histogram for the 3 parameter fit for a SNR of 200, (1a and b), and 500, (1c and d) (32 echoes, echo distance 4ms, spin echo occurred at 12th echo). At low SNR, no prediction of Y can be made as long as vCBV is not known. At higher SNR a distribution around the true value is formed, however, an SNR of at least 500 is required in order to keep the relative parameter error under 10 %. A fixed value of vCBV produces better results at a SNR of 200 than is achieved using vCBV as a fit parameter at a SNR of 500. In case of no T2 decay, changing the position of the spin echo has minor influence on the estimated parameters, providing the SNR at the spin echo is kept constant. For the same distance between two adjacent echoes, a larger number of echoes yield a better result. However, when comparing different number of echoes, but now with a constant total sample time, the effect is minimal. When including T2 decay, the evaluation method is somewhat stabilized by shifting the position of the spin echo to a later echo. Figure 2a shows the obtained Δχ-values from the in vivo measurement where the SNR was estimated to 120. Using vCBV is as a fit parameter results in large relative errors (Δχ = 0.19±0.21ppm, vCBV = 31±31% respectively). When using a fix vCBV value, the result is stabilized (Δχ = 0.59±0.1ppm). Moreover, the distribution of T2 values is always centered around the true value and with small deviation. The curve fitting was additionally performed using the total tissue model from ref. [2] (eq. 10) resulting in a Δχ of 0.12±0.09ppm and a vCBV of 35±23% when both parameters were fitted and a Δχ of 0.27±0.06ppm when using a fix vCBV of 1.5 %. In figure 2b, the measured signal from one pixel is shown exemplarily, together with the fitted signal curves and the estimated parameters. A large discrepancy is to be seen for the obtained parameters although the signal curve is almost impossible to tell apart.
Discussion
The method is very unstable at low SNR if both Y and vCBV is used as fit parameters. When using the extended model, the standard deviation of the estimated Δχ is small, but the obtained vCBV is unlikely to be correct. The signal curve example in figure 2b shows that the extended model exhibits a great instability for low SNR as well. The insensitivity to the spin echo position implies that an early spin echo would be to prefer since the SNR in that case would be higher. The breakdown point of this position has to be further examined as well as the stability of the extended model. The echo distance dependence suggests that it is more important to sample a large time range than to have a small echo distance. A decreased echo distance requires a larger bandwidth resulting in a decreased SNR. If the diffusion effects are negligible [5], using T2 as a fit parameter does not affect the fit stability. In conclusion, accurate fitting can only be performed at very high SNR (>500). The easiest way to increase SNR is to use long measurement times, which is not attractive in the clinic. A separate quantification of the vCBV would allow a stable method to quantify blood oxygenation even at low SNR (<200).
1 Medical Physics in Radiology, German Cancer Research Center, Heidelberg, Germany,
2 Computer Assisted Clinical Medicine, Faculty of Medicine Mannheim, University of Heidelberg, Germany
References
[1] Yablonskiy et al. Magn Reson Med, 32, 749-63 (1994)
[2] He et al. Magn Reson Med, 57, 115-26 (2007)
[3] He et al. Magn Reson Med, 60, 882-888 (2008)
[4] Sedlacik et al. Proc. Intl. Soc. Mag. Reson. Med. (ISMRM) 16, 3104 (2008)
[5] Sohlin et al. Proc. Intl. Soc. Mag. Reson. Med. (ISMRM) 16, 1427 (2008)