Sie befinden sich hier
Inhalt
M. Amann,M. Bock,L. R. Schad
Introduction
Spiral readout has been demonstrated as a promising technique in 3D contrast enhanced magnetic resonance angiography (3D CE-MRA) to shorten acquisition times [1]. The major drawback of spiral readout is its sensitivy to susceptibility artifacts. Data correction for field inhomogeneities is a prerequisite to attain valuable results. To estimate local offset frequencies, direct measurement of a field map was proposed [2], which requires additional measurement time. An alternative strategy of deblurring estimates the field map from the data itself. The particular image is reconstructed at certain supposed offset frequencies. Next, the imaginary part of the reconstructed image is minimized for each point in space over a specific summation window [3].
If, as in multiphase 3D CE-MRA, the same anatomical region is scanned repeatedly, it would be desirable to estimate the field maps once and then applying them to correct all data sets, since the calculation for a 3D slab is relatively time consuming. However, the transit of contrast media changes the local susceptibilities [4]. The aim of this study was to investigate the dynamic changes of the calculated offset frequencies in correlation to the contrast bolus passage.
Materials and methods
Multiphase spiral 3D CE-MRA were acquired on a 1.5 T whole body scanner (Magnetom Vision, Siemens, Erlangen Germany). A contrast bolus (Magnevist) of 0.2 mmol/kg bodyweight was administred to volunteers by automatic infusion. All measurements were performed with a phased array torso coil. Per 3D partition, 16 interleaved spirals with a duration of 15.36 ms were acquired. For each spiral, 2048 data points were sampled. The other parameters were: TR/ TE/ a= 19.0 ms/ 1.3 ms/ 60°. A nominal resolution of 1.39 x 1.39 mm2 at a FOV of 350x350 mm2was obtained. For a 80 mm coronal slab with 44 interpolated partitions an acquistion time of 6 s was obtained for a single phase. Five phases were acquired subsequently.
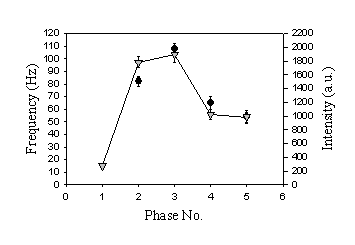
For each partition of each phase, a corresponding field map was calculated with the deblurring algorithm. A 24x24 summation window was chosen to minimize the imaginary part in a frequency search range from -200 Hz to +200 Hz. The images were then corrected with respect to the cor-responding field maps. To visualize the dynamic effect of the contrast media transit, both the signal intensity and the computed offset frequency were plotted. A ROI was positioned in the aorta at the level of the branching of the renal arteries. The same ROI was positioned on the corresponding field maps and the changes of the local offset frequency were detected. The first ('null') phase was skipped because of large inter-individual variations.
Results
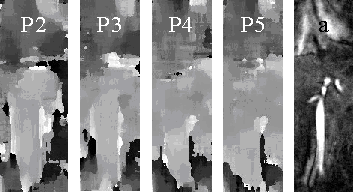
Fig. 1 shows the calculated field maps (2-5) of four consecutive phases and the corresponding anatomical image for comparison. The aorta with its different local susceptibility is clearly visible in all field maps. Also the fading of contrast enhancement in the later phases is noticeable.
In all volunteers, the changes of the calculated local frequency correlate with the measured aortic signal intensity. We detected frequency changes of about 50 Hz synchronous to the transit of the contrast media. Fig. 2 shows the variations for a characteristical case.
Discussion
Since both signal intensity and susceptibility are proportional to the contrast media concentration, the correlation between the calculated offset frequency and the vessel signal change is an evidence for the accuracy of the deblurring method.
Due to the detected frequency changes of about 50 Hz it is necessary to deblur the images of each phase separately. Also, it is not possible to measure the field maps before or after applica-tion of the multiphase 3D CE-MRA.
The detected frequency changes are relevant not only for the spiral readout, but also for all MRI techniques with small bandwith.
References
[1] Amann M. et al., [2000] 8th ISMRM: 1788
[2] Irarrazabal P. et al., [1996] Magn. Reson. Med. 35: 278-282
[3] Noll D. C. et al., [1992] Magn. Reson. Med. 25: 319-333
[4] Kennan et al., [1994] Magn. Reson. Med. 31: 9-21