Sie befinden sich hier
Inhalt
Flow Quantification from 2D PC-MRI in Renal Arteries using Clustering
F.G. Zöllner1,2, J. A. Monssen3, J. Roervik2,3, A. Lundervold4
Introduction
- Renal Disease caused e.g. by hypertension
- Renal Artery Stenosis (RAS) leading cause for renal hypertension
- Loss of renal parenchyma in the stenosed kidney
- Microangiopathy in glomeruli in non-stenosed contralateral kidney
- Important parameter for choosing patients to treat by PTA:
- Kidney volume
- Flow reduction
- Flow velocity
- Renal function
- Cine Phase Contrast MRI tool for grading stenosis
- Can be used for assessing blood flow and velocity
Methods
- Today: mainly manual ROI drawing in magnitude images, frame-by-frame
- Automated procedures:
- Active contours
- Correlation and manual thresholding
- K-Means clustering of velocity profiles in phase images
- Random initialisation of algorithm, 10 repetitions
- Explored cosine distance function, Eucleadian and correlation distance
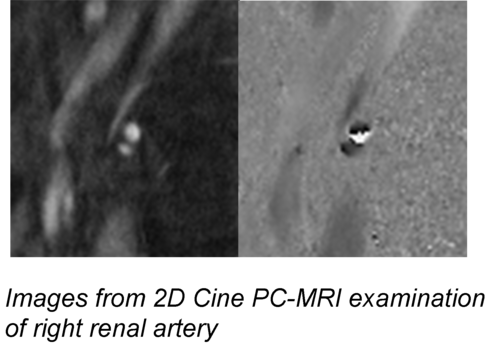
Data acquisition
- 5 subjects (3 healthy volunteers, 2 patients)
- ECG gated 2D Cine PC-MR sequence
- TE=4ms,TR=37ms, FA=30°, VENC=100 cm/s
- 20-25 images per cardiac cycle, RR-Interval 758-1072ms, 2 averages, matrix 256x192
- Slice thickness 6mm, in-plane resolution <0.5mm2
- Transec. slice through vessel 1-2cm distal of stenosis
Results
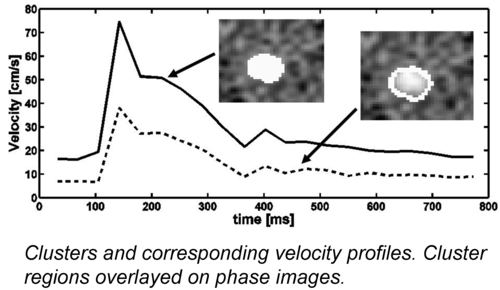
- Descrimination of vessel from background for K=2
- Analysis of optimal cluster number:
- 2 local minima for DB-Index
- K=3-5 and K=8-10 depending on the subject
- For K>2 vessel area devided into subcluster
- Cosine distance function yielded best results
- Phase wrap included in one dataset showed up as a seperate cluster
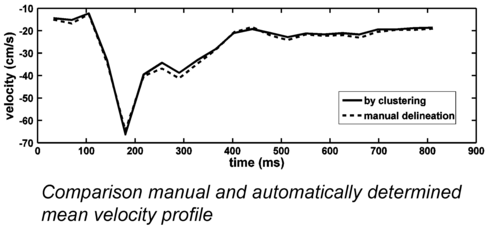
- Comparison manual vs. clustering showed high similarity in the velocity profiles

Discussion
- Semi-automatic approach using K-Means clustering
- Reduced manual interaction
- Only number of clusters has to be given
- Obtained velocity profiles similar to manual delineations
- Detection of different blood flow patterns at higher K values, i.e. more allowed clusters
- Interpretation needs further investigation
- Conclusion: approach can aid in clinical assessment and grading of renal artery stenosis
1 Computer Assisted Clinical Medicine, Faculty of Medicine Mannheim, University of Heidelberg, Germany
2 Dept. of Surgical Sciences, University of Bergen, Norway
3 Dept. of Radiology, Haukeland University Hospital , Norway
4 Dept. of Biomedicine, University of Bergen, Norway