Sie befinden sich hier
Inhalt
Pulsewave Velocity Measurements using an optimized Phase Contrast Sequence
J. M. Boese, M. Bock, S. O. Schoenberg, L. R. Schad
Introduction
The pulsewave velocity, i.e. the rate of propagation of flow or pressure in arteries, depends on the distensibility of the vessel wall, and can therefore be used for evaluation of pathologic changes, such as atherosclerosis. For aneurysms, so far no suitable parameter can reliably predict the individual risk of rupture [1]. We are interested in the question, if pulsewave velocity measurements can be used to assess pathologic vessel wall changes which might correlate with the risk of aneurysm distension. Several methods have recently been proposed for pulswave velocity measurement, most of them based on phase contrast techniques [2,3,4]. However, their application in patients with progressive aortic disease is problematic, as saturation effects make accurate velocity determination difficult. In this study we optimized the phase contrast method to be able to obtain reliable pulsewave velocity measurements even under unfavourable conditions within an acquisition time of about five minutes, which allows for clinical routine examinations.
Methods
Data Acquisition
The measurements were performed on a 1.5 T whole body scanner (Siemens Vision), with maximum gradient strength of 25 mT/m and slew rate of 40 T/m/s. Velocity waveforms were measured in two slices perpendicular to the aorta using a phase contrast gradient echo pulse sequence with through-plane velocity encoding. As high spatial resolution is not required, a matrix size of 32 by 128 (50% rectangular field of view) was used to save imaging time. Further sequence parameters include: TE = 3 ms, TR = 6 ms, a = 30°. ECG triggering is known to produce artifacts arising from changes in the heart rate, which disturb the steady state of the magnetization and result in phase distortions [5]. To avoid these problems, we apply retrospective gating. Acquisition of the ECG signal is problematic during continuosly running pulse sequences that involve switching of large gradients at short rise times. Therefore we used a prototype ECG system that is optically decoupled [6].
As we found large variations in the peak flow velocity, we implemented pulse sequences with different velocity encoding (VENC). The optimal VENC was determined by a preceding segmented EPI phase contrast measurement [7], which is acquired within 20 s.
Generally, velocity quantification pulse sequences are using the phase difference of a velocity encoded and a velocity compensated scan. In order to save time, we only acquire velocity sensitive data. To remove residual phase variations, the phases are corrected by subtracting the phases of data aquired directly at the beginning of the cardiac cylce, where only small blood flow occurs.
Thus 800 images from each of two slices can be acquired within about five minutes. These are retrospectively sorted into time frames of 6.7 ms, so that for a typical heart rate of 0.9 s, effectively nine acquisitions are averaged.
Data Analysis
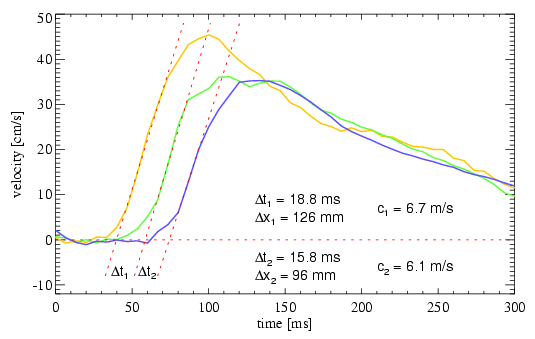
The time delay between the velocity waveforms is calculated using only data from early sytole to avoid distortions from wave reflections. A line is fitted to the systolic ascent of the flow wave. The intersection of this line with the baseline defines the onset of the velocity peak (see Fig. 2). The pulsewave velocity is calculated from the known spatial distance dx and the measured temporal difference dt of the onsets of the velocity peaks as c = dx / dt.
Results
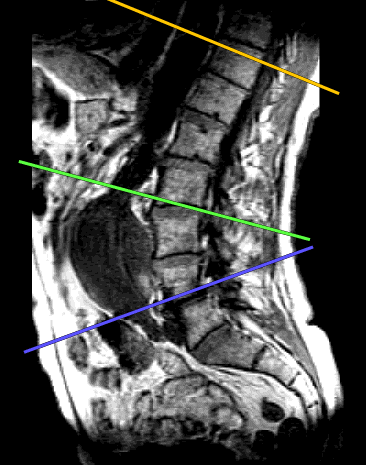
In a preliminary study, the method was applied to six healthy volunteers (age 20 to 30), which show velocities ranging from 3.2 to 5.0 m/s. These are in accordance with data given in the literature [8]. In three older subjects (age 65 to 72) without aneurysmatic disease, velocities ranging from 6 to 10 m/s were found. This increase with age is a well known relation. It was also possible to obtain reliable pulsewave velocity data from two patients with aortic aneurysms. Fig. 1 shows a sagittal T1-weighted localizer image from a 71-year old patient with an aortic aneurysm. Velocity time curves were acquired at the slice positions indicated and are shown in Fig. 2 together with the calculated wave velocities.
Discussion and future work
We have optimized the phase contrast method for reliable pulsewave velocity measuments under clinical conditions. With retrogating, velocity data from the complete cardiac cycle is available, so that more refined methods for pulsewave velocity determination based on e.g. Fourier analysis could be applied. We plan a patient study to measure pulsewave velocity in aortic aneurysms prior to surgery in order to correlate the results with histopathologic parameters of surgical specimens. Thereby it should be further investigated if detected changes in vessel distensibility are helpful for the assessment of the risk of aneurysm rupture.
1 SIEMENS Medical Systems, Erlangen, Germany
References
[1] Schönberg, S.O., Knopp, M.V., Bock, M., Kallinowski, F., et.al., Radiology 203, 45-53 (1997)
[2] Bock, M., Schönberg, S.O., Schad, L.R., et.al., JMRI 8, 889-895 (1998)
[3] Felblinger, J., Lehmann, C., Boesch, C., Magn. Reson. Med. 32, 523-529 (1994)